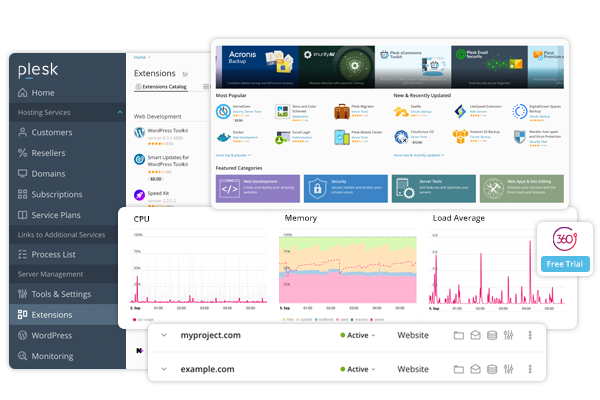
Plesk Panel is a comprehensive web hosting control panel that offers various tools and features to manage websites efficiently. Among its many functionalities, one of the crucial aspects is the ability to monitor and analyze website traffic statistics. Understanding traffic statistics and analysis in Plesk Panel is essential for website owners and administrators to make informed decisions about their online presence. In this article, we will delve into the details of how to access, interpret, and utilize traffic statistics and analysis tools provided by Plesk Panel. Visit the article at Understanding Traffic Statistics and Analysis in Plesk Panel to learn more.
SEO Meta Description: Learn how to access, interpret, and utilize traffic statistics in Plesk Panel to optimize website performance and enhance your online presence.
Accessing Traffic Statistics
Accessing traffic statistics in Plesk Panel is straightforward. Follow these steps:
- Log in to your Plesk Panel account.
- Navigate to the “Statistics” section, usually located under the “Websites & Domains” tab.
- Select the desired domain or website to view its specific traffic statistics.
- Review the available data, such as visitor counts, bandwidth usage, and referrer information.
In addition to these basic steps, Plesk Panel allows users to export traffic data in various formats, such as CSV or XML, making it easier to perform deeper analysis using external tools.
Types of Traffic Statistics
Plesk Panel provides various types of traffic statistics, including:
- Visitor Statistics: This includes information about the number of visitors, unique visitors, page views, and session durations.
- Bandwidth Usage: This shows the amount of data transferred to and from your website.
- Referrers: Referrer statistics indicate the sources from which visitors accessed your website, such as search engines, social media platforms, or other websites.
- Search Keywords: This section displays the keywords or phrases users entered into search engines before landing on your website.
- Error Logs: Error logs provide insights into any issues encountered by visitors while accessing your website, such as broken links or missing pages.
Each of these statistics plays a vital role in understanding how your website performs and how users interact with your content. For example, monitoring bandwidth usage helps you determine if your current hosting plan is sufficient or if you need to consider an upgrade to accommodate growing traffic.
Interpreting Traffic Statistics
Understanding traffic statistics involves analyzing the data to gain insights into your website’s performance. Here are some key aspects to consider:

- Visitor Trends: Monitor fluctuations in visitor numbers over time to identify patterns and trends. Understanding these trends can help you adjust your content strategy or marketing efforts to capitalize on peak traffic periods.
- Popular Pages: Identify which pages receive the most traffic and optimize them for better performance. This might include improving load times, updating content, or enhancing SEO efforts on these pages to retain and attract more visitors.
- Referral Sources: Determine which sources drive the most traffic to your website and focus on maximizing those channels. For instance, if a significant portion of your traffic comes from social media, consider increasing your activity or advertising on those platforms.
- Search Engine Performance: Analyze the effectiveness of your SEO strategies by reviewing search keywords and referral traffic from search engines. This data can guide your keyword strategy and help you improve your search engine rankings.
- Bandwidth Usage: Keep track of your bandwidth usage to ensure your hosting plan meets your needs and consider upgrading if necessary. Consistently hitting bandwidth limits might suggest it’s time to switch to a higher-tier hosting plan to accommodate your growth.
It’s also essential to look at error logs to identify any recurring issues that might be affecting user experience. Broken links or missing pages can lead to higher bounce rates and lower visitor satisfaction, so addressing these errors promptly is crucial.
Utilizing Traffic Analysis Tools
Plesk Panel offers several tools to further analyze website traffic:
- AWStats: AWStats is a powerful log analyzer that provides detailed graphical and statistical information about website visitors, including browsers, operating systems, and geographical locations. This data can be invaluable for tailoring your website to meet the needs of your audience more effectively.
- Webalizer: Webalizer generates detailed, easy-to-read reports on website usage, including hourly, daily, and monthly statistics. These reports can help you understand peak usage times and adjust your server resources accordingly.
- Google Analytics Integration: You can integrate Google Analytics with your website through Plesk Panel to access advanced tracking and analysis features offered by Google’s powerful analytics platform. Google Analytics provides deeper insights into user behavior, conversion rates, and the overall effectiveness of your digital marketing strategies.
Conclusion
Understanding traffic statistics and analysis in Plesk Panel is essential for optimizing website performance and maximizing online presence. By regularly monitoring and analyzing traffic data, website owners and administrators can make informed decisions to improve user experience, increase traffic, and achieve their online goals. With the variety of tools and features provided by Plesk Panel, managing website traffic has never been easier. To learn more about this, visit Understanding Traffic Statistics and Analysis in Plesk Panel.


